Changing to CDC Transmission Risk Levels
You are now switching to a different risk level set. These new levels, the CDC Transmission Indicators, use the same
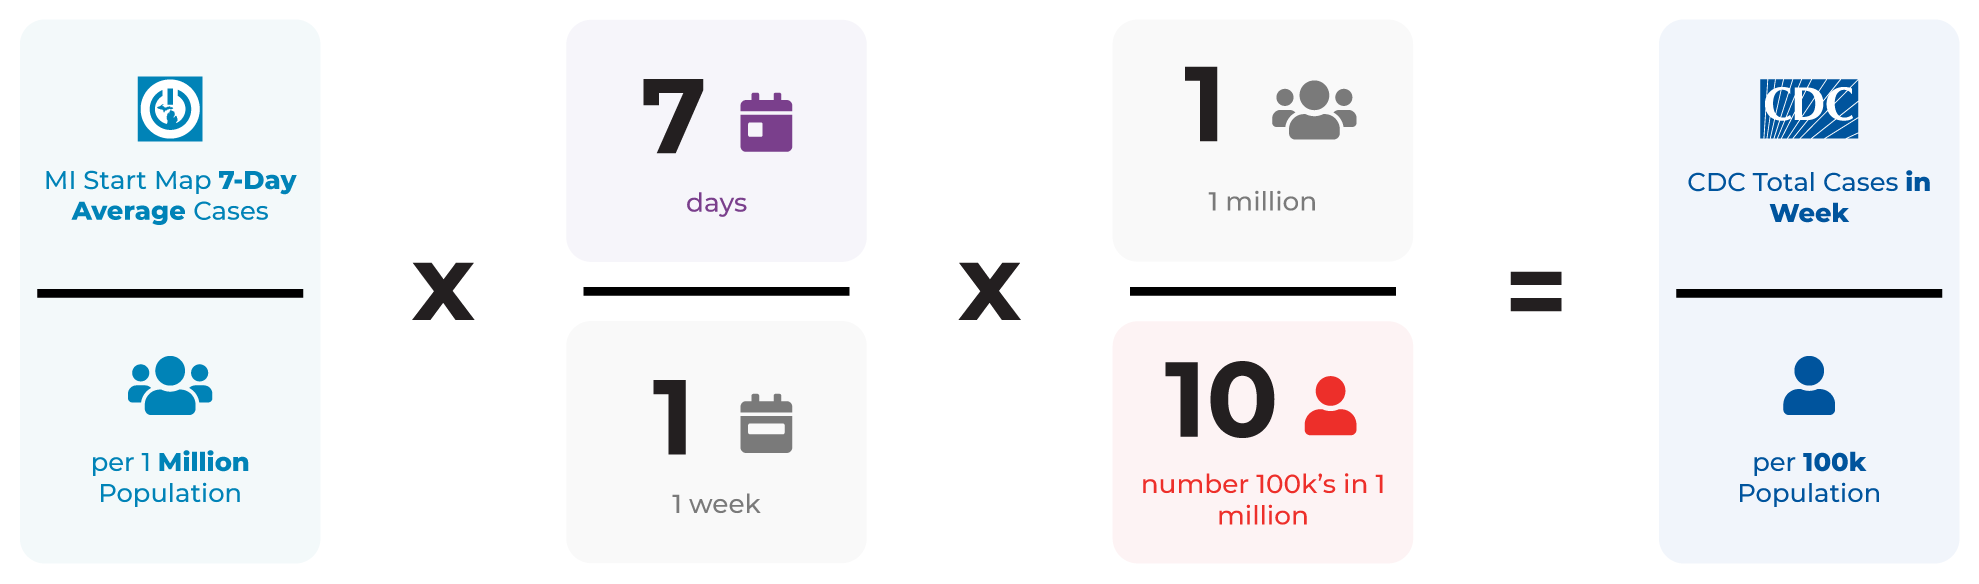
metrics as the MI Start Map Level (% positive tests and case rates) but calculate them
differently. MI Start Map applies CDC methodology to the most up to date State of Michigan information, and can be used in accordance with
CDC’s guidelines. The CDC recommends “For the most accurate and up-to-date data for a specific county or state, visit the relevant state or local health department website.“
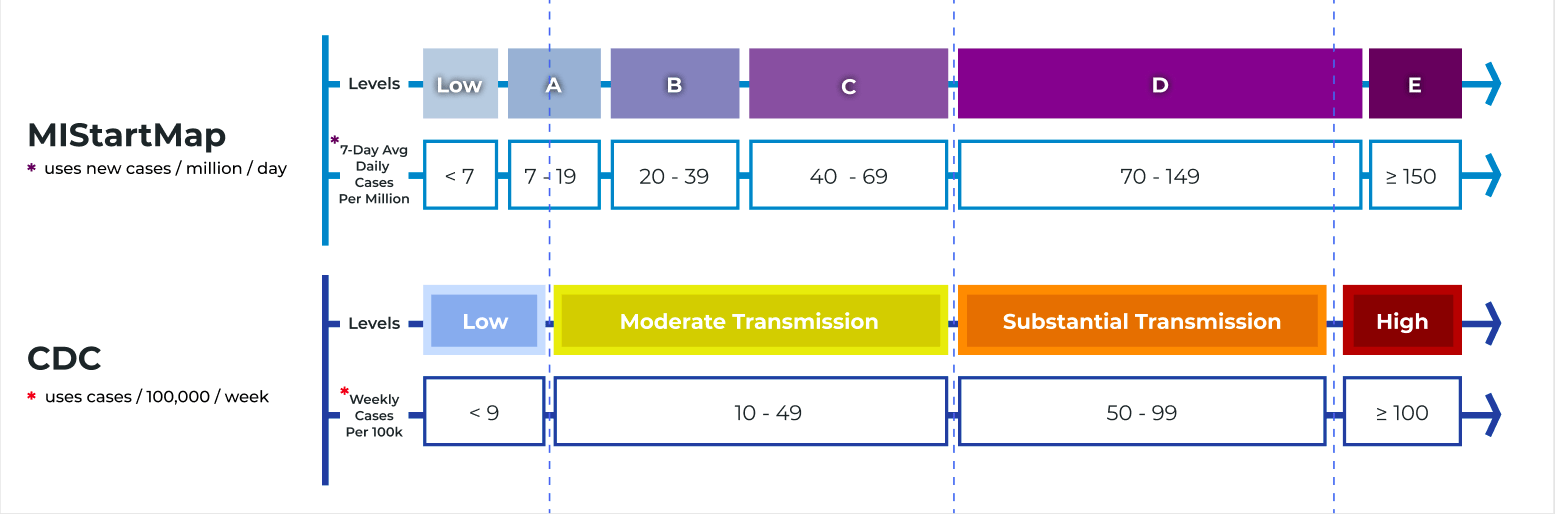
Risk level calculation:
MIStartMap Risk Levels
Uses the worse indicator of
- the 7-day average number of new cases per million population per day by onset date OR
- the 7 day average percent positivity
⟶
↓
Risk level calculation:
CDC Transmission Risk Levels
Uses the worse indicator of
- total new cases per 100,000 population over the previous 7 days by report date OR
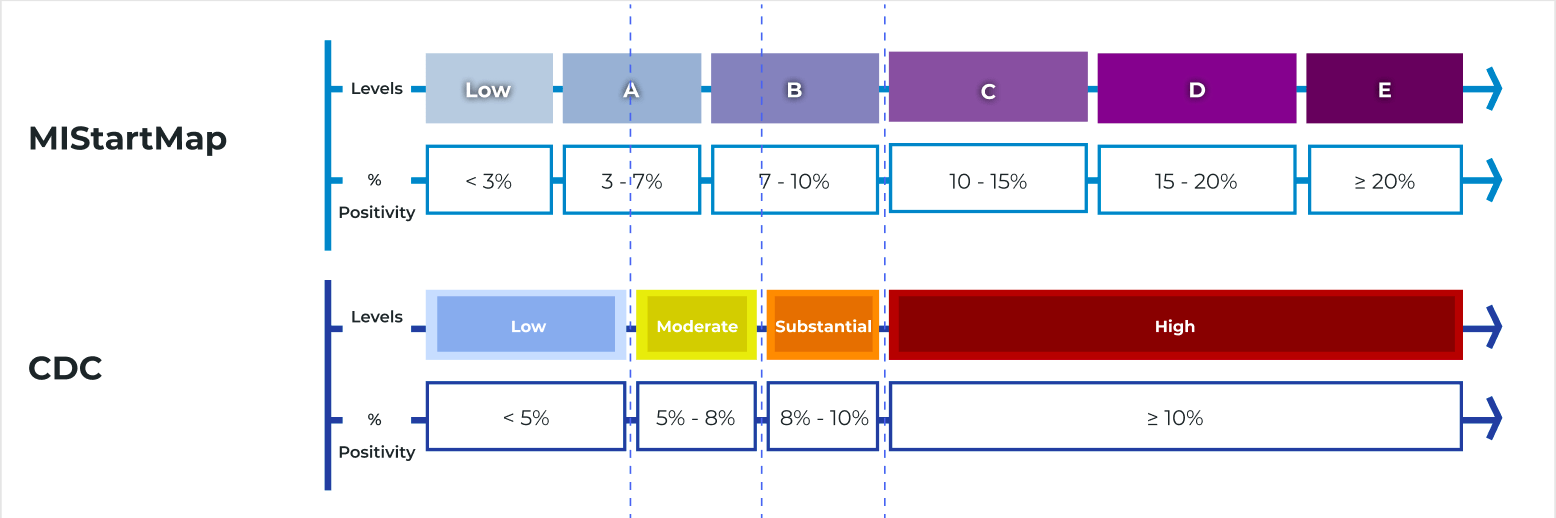
- the 7 day average percent positivity
Tests Percent Positivity Comparison